Home › eCommerce Finance › Trading Margin, ROAS and Repeat Purchase
THE E-COMMERCE FOUNDER’S GUIDE
Trading Margin, ROAS
and Repeat Purchase
The easiest way to lose money in eCommerce is to look at the wrong numbers and feel reassured. These are the metrics that decide whether growth is creating value — or burning it.


Key Takeaways

E-COMMERCE HUB
The Founder’s Guide
Article 4 of 7
- Business Model and Metrics
- Working Capital and Inventory
- Amazon, DTC and Wholesale
- 04Trading Margin, ROAS and Repeat Purchase
- 05Brand-Led vs Smash-and-Grab
- 06Promotions, Bundles and Margin Leakage
- 07Forecasting, Seasonality and Growth Pacing
- 08Services
NEED A STEER?
30 minutes with a finance lead — no pitch.
We will tell you, honestly, where your model is leaking.
Book a Discovery CallIn this article
The wrong numbers will reassure you all the way to insolvency.
Revenue is not enough. ROAS on its own is not enough. Even a healthy gross margin can flatter a weak model if paid media, shipping, returns and discounts are quietly eating the business.
That is why we anchor founders around trading margin: the money left after the direct product cost, fulfilment drag and variable marketing spend have all had their say. ROAS, AOV, repeat purchase and time-to-second-order then explain whether trading margin is structural — or temporary.
The numbers that tell the truth.
Average order value matters because low baskets leave too little room for paid acquisition. Repeat purchase matters because that is where a weak first-order model can be rescued. Time to second order matters because a repeat six months away is much less helpful than one inside thirty days.
Trading Margin
Revenue − COGS − Fulfilment − Variable marketing
The money left after the direct product cost, fulfilment drag and variable marketing spend have all had their say. A healthy gross margin can flatter a weak model — trading margin cannot be flattered the same way.
ROAS / MER
Ad revenue ÷ Ad spend • Total revenue ÷ Total marketing
Too many dashboards use the wrong revenue base, the wrong attribution view or a VAT-inclusive number that flatters performance. Pair ROAS with MER — total revenue divided by total marketing spend.
Average Order Value
Net revenue ÷ Number of orders
AOV matters because low baskets leave too little room for paid acquisition. Bundles, free-shipping thresholds and post-purchase upsells are the levers — but a discount-driven AOV is self-defeating.
Repeat Purchase Rate
% of customers who buy again within 90 days
Repeat purchase matters because that is where a weak first-order model can be rescued. A single repeat-rate number hides cohort decay — always look at it by acquisition month.
Time to Second Order
Median days between order 1 and order 2
A repeat six months away is much less helpful than one inside thirty days. Time-to-second-order is the truest read on product–market fit because it reflects whether customers actually want the next purchase.
Get clearer forecasts and smarter stock decisions
Book a discovery call if you want clearer forecasting, better stock decisions and more confidence in the economics of growth.
A good metric stack forces clarity.
Ask these four questions of any dashboard. If it cannot answer them, it is decoration.
Are we making money on the first order?
If not, how quickly does the second order arrive?
What proportion of a new cohort comes back?
How much of our customer value is real, and how much is just hope?
“If a business does not know those answers, it is not scaling. It is guessing at scale.”
That is why Ascendant pushes a design-for-profit mindset early. If you expect around a third of revenue to disappear into paid media, another meaningful share into product cost, more into shipping and returns, and more again into overhead, then a weak starting margin profile leaves almost nothing left to fund growth.
You cannot rely on enthusiasm and headline revenue to rescue that.
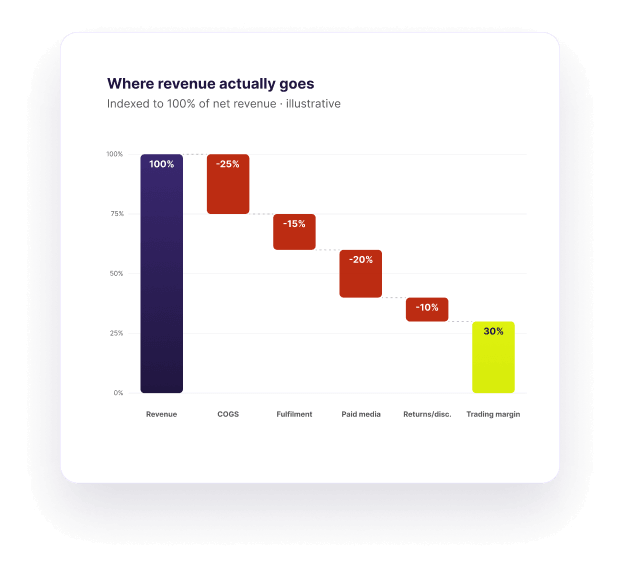
The trading-margin bridge
This is illustrative — the shape is the lesson, not the exact percentages. Where revenue actually goes before it becomes trading margin.
Illustrative · Indexed to 100% of revenue
Where revenue actually goes before it becomes trading margin.
Formula reference
Print this. Tape it to the wall above the dashboard. Hold every monthly review against it.
| Metric | Formula | Healthy range | Common pitfall |
|---|---|---|---|
TMTrading margin | Rev − COGS − Fulfilment − Var. marketing | 25–35% | Overhead allocated in; flatters channel mix. |
GMGross margin | Revenue − COGS | 60–75% | Hides true unit economics. Useful, not sufficient. |
ROROAS | Ad revenue ÷ Ad spend (per platform) | 3–5× | Double-counts conversions across channels. |
MEMER | Total revenue ÷ Total marketing spend | 3–5× | Lags shifts in mix between paid and organic. |
AOAOV | Net revenue ÷ Number of orders | Brand-specific | Discount-driven AOV erodes margin faster than it lifts cash. |
RPRepeat purchase rate | % buying again within 90 days | 30%+ at 90d | Single # hides cohort decay; report by acquisition month. |
T2Time to 2nd order | Median days between order 1 and order 2 | 30–60 days | Power-user skew. Use median, not mean. |

The eCommerce Playbook
Our master guide: 50 pages of everything we know about scaling online brands profitably — channel economics, ROAS, margin design, stock, cash and exit value.
Joins you to the eCommerce profitability series. Unsubscribe anytime.
Our eCommerce Services
Talk to an expert about your eCommerce challenge
Hundreds of online brands supported across Shopify, Amazon and wholesale. Whether it’s cash, margin, stock or messy numbers, she’ll tell you what to fix first.
eCommerce accounting — common questions
5 questions · click to expand
No. ROAS isolated by platform routinely double-counts conversions, ignores organic and email-driven revenue, and is sensitive to attribution model choice. Two campaigns with the same on-platform ROAS can have very different blended impact.
Pair ROAS with MER (total revenue ÷ total marketing spend). MER is harder to game and surfaces the question that actually matters — is marketing in aggregate creating margin?
Directly. If your trading margin per order is £18, you cannot spend £25 acquiring the customer and expect to survive on the first order. Lifting AOV widens the budget you can spend on Meta or Google without going under-water.
The lever pairs with repeat. A modest AOV combined with a strong 90-day repeat rate gives you patience; a low AOV with a weak repeat rate forces ruthless CAC discipline.
For consumables and apparel, 30%+ within 90 days is a good marker. For higher-consideration goods, the window stretches but the principle holds: customers who do not return inside 90–180 days rarely return at all.
Always report by acquisition cohort. A single blended number can mask the fact that recent cohorts have collapsed while older ones prop up the average.
Start from net revenue (after returns and discount leakage). Deduct COGS at fully-loaded landed cost. Deduct fulfilment (3PL, packaging, last-mile carriage). Deduct variable marketing — every pound of Meta, Google, marketplace and influencer spend that scales with revenue.
What is left is trading margin. Do not allocate overhead inside it. Overhead belongs in the next step — operating margin — because mixing the two destroys channel and SKU comparability.
Cash. A second order at 30 days repays acquisition while you are still spending into the next cohort. A second order at six months means you have funded six months of working capital with hope.
It is also the most honest signal of product fit. People who genuinely love the product come back fast — long gaps suggest the first purchase was driven by discount or one-time intent.